
Understanding your statistics
How to read and interpret the data on your Unboared dashboard.
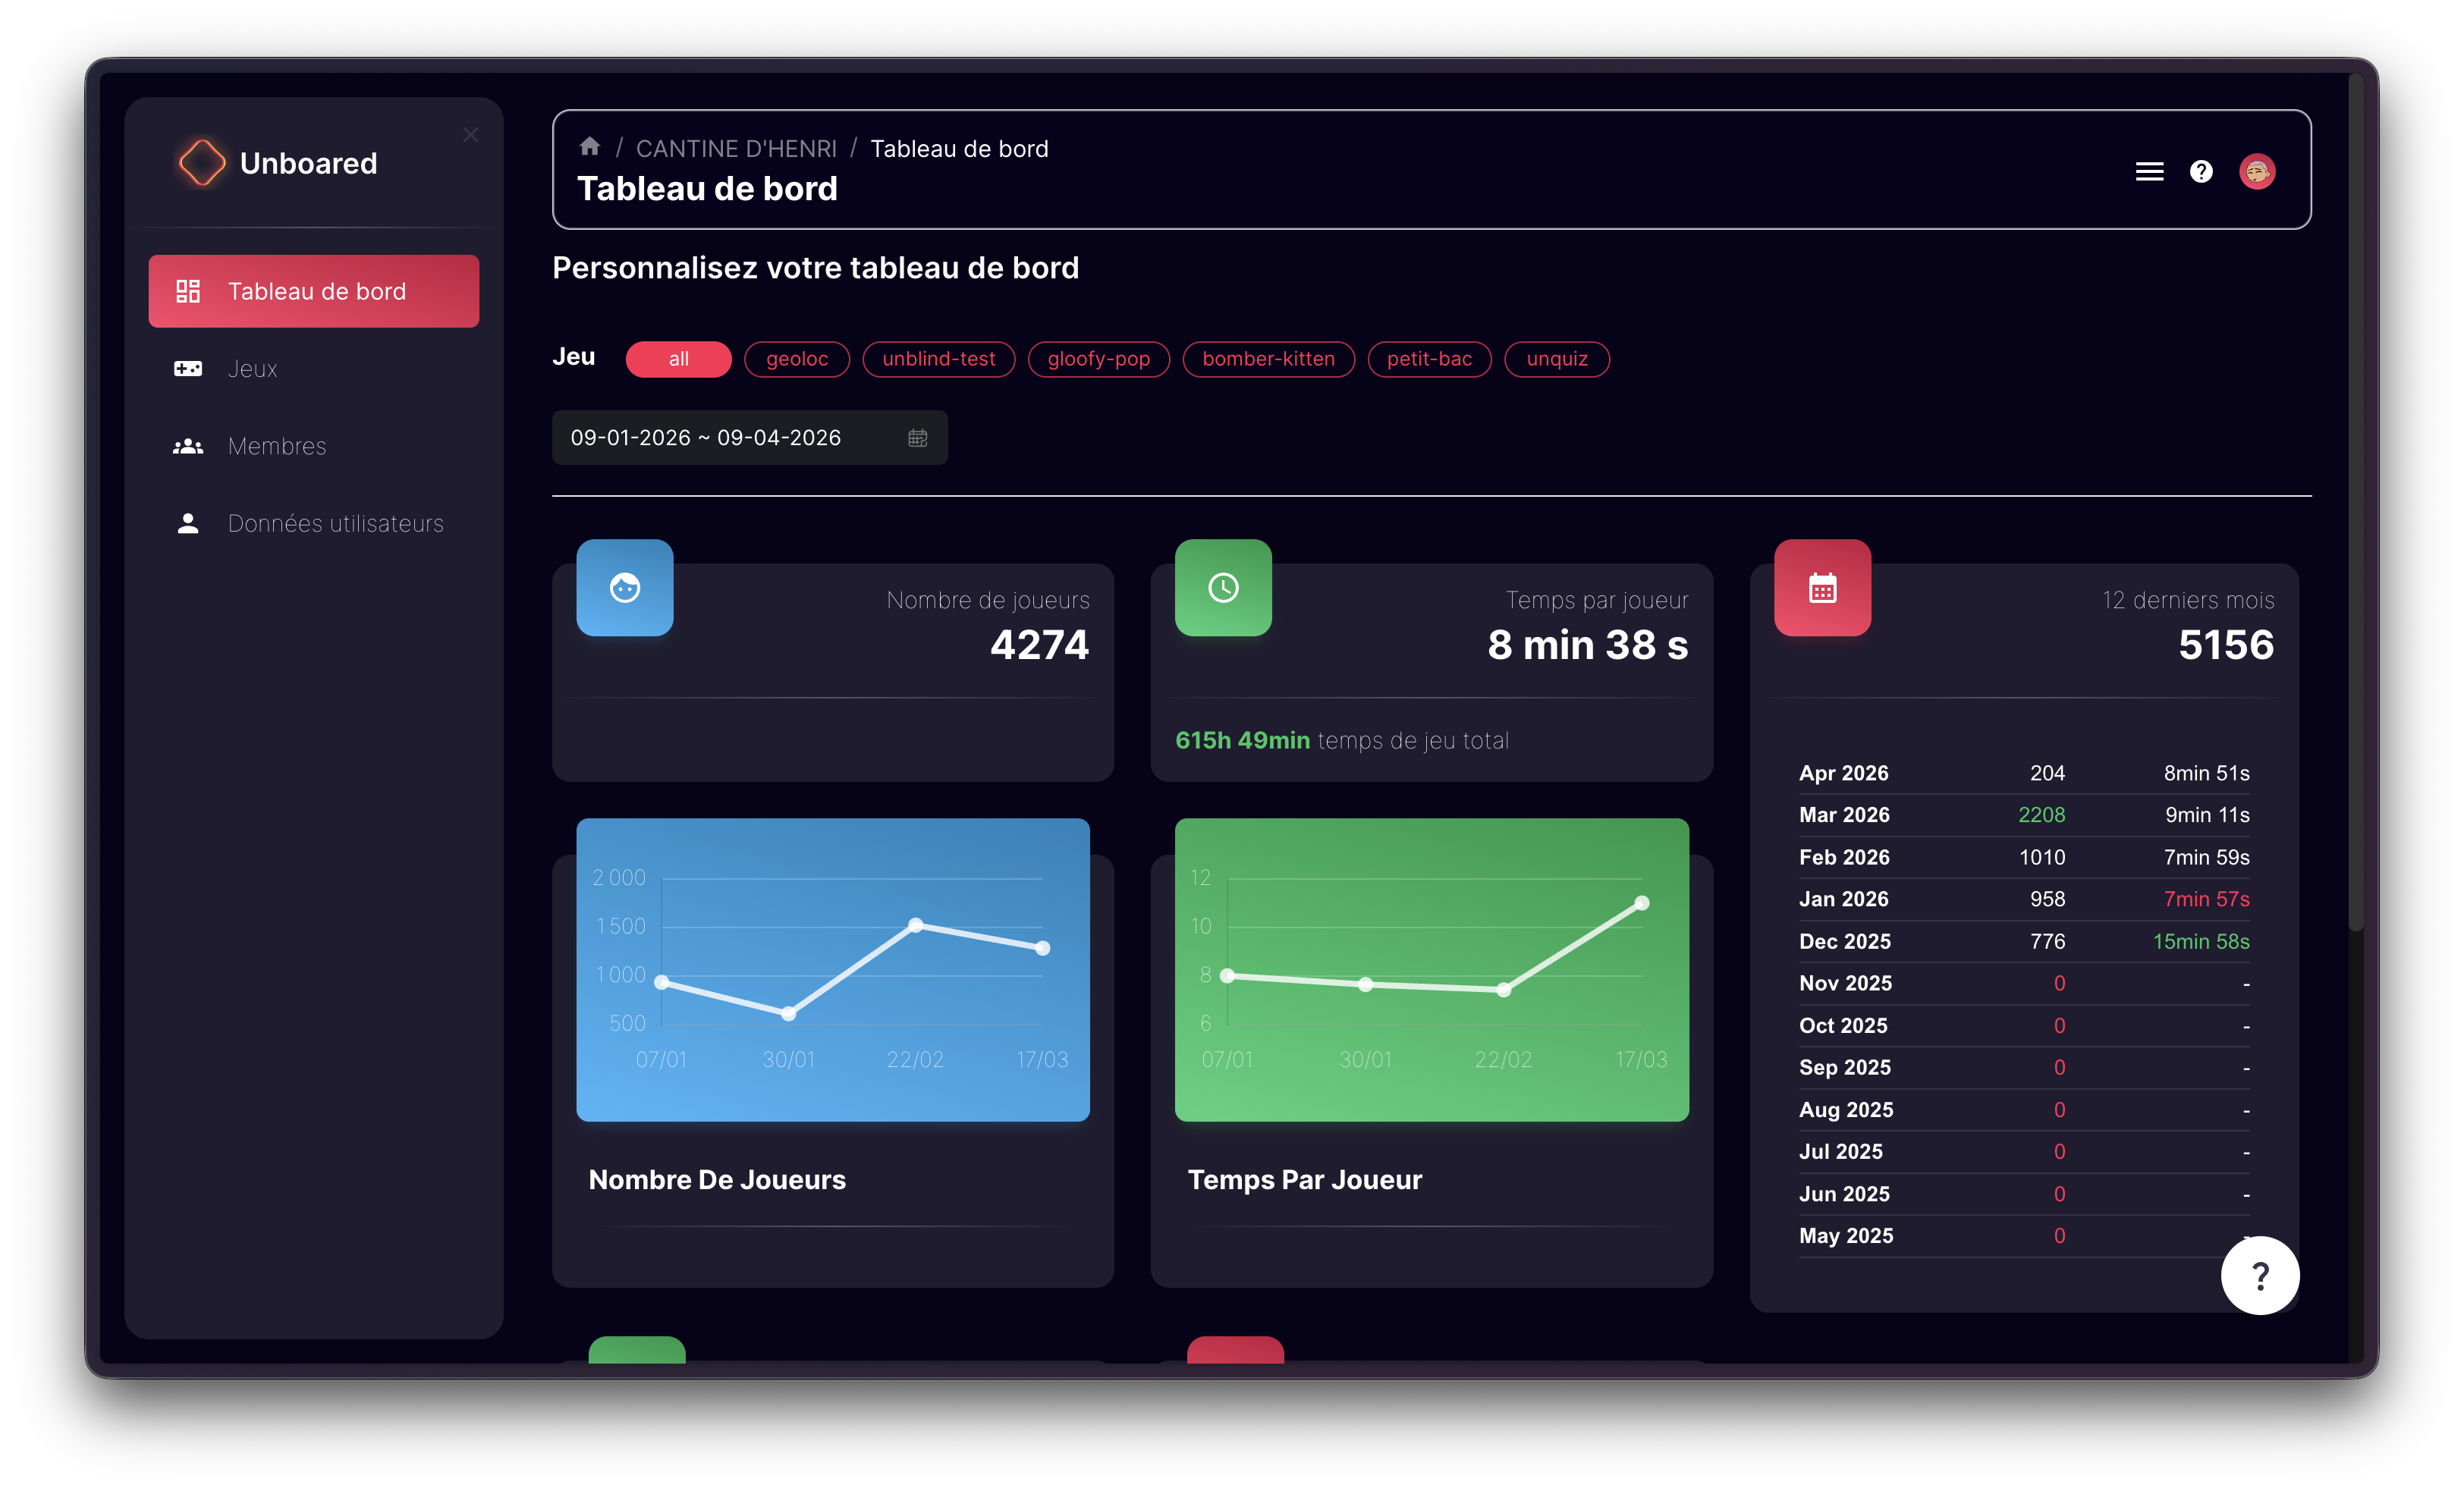
Key metrics
On your dashboard, you'll find the key indicators for your activity:
Number of players
The total number of players who scanned the QR code and played during the selected period. This is your primary engagement indicator.
Time per player
The average play time per player. A high value (> 5 minutes) indicates strong engagement.
Usage time
The total time your Unboared installation was active.
Filtering your data
Use the date selector at the top of the page to display statistics for a specific period:
- Today
- Last 7 days
- Last 30 days
- Last 3 months
- Last 12 months
Charts
The dashboard offers several visualizations:
- Player trends: a chart showing the number of players over the period
- Breakdown by game: what percentage of time is spent on each game
- Concurrent players: peak number of players at the same time
Monitor the breakdown by game to identify your audience's favorites. This will help you choose the right games for your next events.